Isn't it always a great pleasure to install new software? Especially if some installation steps dont work. However, gracefull developers always include instructions some of them very helpful, like "Click on Continue", others epically useless. E.g.
So this guy wants to install phpBB. From phpBB: "If you see a "Could not connect to the database" error, this means that you didn't enter the database data correctly and it is not possible for phpBB to connect. Make sure that everything you entered is in order and try again. Again, if you are unsure about your database settings, please contact your host." Oh really? No, I enter wrong stuff ON PURPOSE because I enjoy spending time reading error messages YOU MORONS!
Dienstag, 20. Dezember 2011
Freitag, 11. November 2011
Talks: Comments
What makes a good talk? How do I prepare it?
Seminar at a group where nobody knows your work:
Seminar at a group where nobody knows your work:
- Most important point: the talk is not for you, it's for the audience. The talk has to be designed such that the audience enjoys it, not you
- Who is the audience? What do they know? How much introduction is required such that it becomes understandable what I'm saying?
- Once I know who the audience is going to be: draft the talk in four slides. Condense the material
- Readable graphs (large units/labels, thickness of lines), i.e. if graphs are not prepared nicely, it shows that the preparation of the talk was not a priority
- Better the audience understands a little a bit, instead of it totally does not understand anything
- Simple Rule of thumb 1: Not more than two messages per slide
- Simple Rule of thumb 2:
Not more than six bullet points, not more than 6 white-spaced expressions per bullet pointNo bullet points, substitute bullet points by figures Dont read the bullet points, memorize them. Go through them while facing the people, not the slidesAddress each figure and make it clear why it is there- The slides dont substitute the talking. The talking is the main message carrier, the slides should allow to assist when explaining. Thats why text is not required, instead figures
- Dont base the talking on the slides, base the slides on the talking.
- Timing (excluding questions): 5% personal introduction: "who is this guy?", 10% content introduction, 70% content, 10% summary/conclusions, 5% aknowledgements
- Start practicing the talk at least
3 daysa week ahead. - Avoid text
- In the start of the talk, it's fine to show something unrelated so people remember you
Dienstag, 8. November 2011

Donnerstag, 3. November 2011
GNUPlot 002: EPS Bounding Box
I plot some data in gnuplot and want to include it in a Latex document. One option is to use the gnuplot terminal "postscript enhanced eps" and print to an eps file. The eps file can be converted to a PDF and then included in the Latex document which is compiled with pdflatex. However, it may happen that the bounding box is too large and then the diagram takes up too much space. And nobody wants to hand-edit the bounding box, or manually select the graph in Preview and save manually to pdf.
What I now do is to use gnuplot terminal "postscript enhanced" and print to ".ps" file. Then I use the tool ps2eps, which generates a better bounding box. The call is
-f: forces overwrite of existing eps files, -B recalculates bounding box, -l adds a bit to it, so it does not terminate on the labels, -R + sometimes rotation is required. No output file is required.
Then, the .eps file is opened in preview and saved to PDF. If using "convert" again PDF will have a too large white space margin, probably there are some options to adjust this, havent found them yet.
Another option (Credits: Janus)
http://www.gnuplot.info/scripts/files/fixbb
What I now do is to use gnuplot terminal "postscript enhanced" and print to ".ps" file. Then I use the tool ps2eps, which generates a better bounding box. The call is
ps2eps -f -B -l -R + data.ps
-f: forces overwrite of existing eps files, -B recalculates bounding box, -l adds a bit to it, so it does not terminate on the labels, -R + sometimes rotation is required. No output file is required.
Then, the .eps file is opened in preview and saved to PDF. If using "convert" again PDF will have a too large white space margin, probably there are some options to adjust this, havent found them yet.
Another option (Credits: Janus)
http://www.gnuplot.info/scripts/files/fixbb
Mittwoch, 2. November 2011
Latex 001: Making a table cover the page width
The below Latex element defines a table which extends over the whole page width. Notice the 'table*' environment, which lets the table extend over two columns.
\begin{table*}[htbp]
\begin{tabular*}{\textwidth}{l@{\extracolsep\fill}lrrrr}
\\\hline
1B2V & 32 & -4.06 & 4.23 & 4.72 & 7.30\\
1DUK & 64 & -0.35 & 3.94 & 4.45 & 4.80\\
1DEK & 137 & 1.88 & 4.87 & 5.19 & 5.80\\
\end{tabular*}
\caption{Some values.}
\label{tab:values}
\end{table*}
Dienstag, 1. November 2011
CGI 001: Combining Javascript and CGI
I wrote a minimal example involving Javascript and CGI.
Javascript only
Important to note is that the CGI script access the element name property, not the ID.
<html>
<script type="text/javascript">
    function helloworld()
    {
        document.write("Hello World.");
    }
</script>
<body>
    <input type="button" value="Hello World." onClick="helloworld()">
</body>
</html>
</pre>
Including CGI:
<html>
<script type="text/javascript">
    function helloworld()
    {
        return true;
    }
</script>
<body>
    <form action="./hello.cgi" onSubmit="return helloworld()">
        <input type="submit" value="Hello World.">
    </form>
</body>
</html>
The CGI part in Python#!/usr/bin/python print "Content-type: text/plain\n\n" print "Hello World."The Javascript function is nothing but a pseudo-function. It does nothing, but control of flow does go through it, otherwise the form is not submitted to the CGI.
Important to note is that the CGI script access the element name property, not the ID.
Mittwoch, 14. September 2011
GNUPlot 001: Postscript postproduction
I generated a graph with gnuplot:
Settings were:
If i open this file in preview, the file is oriented 90° counter-clock wise. This can be fixed with 'ps2eps'.
The command I used was:
Settings were:
 set terminal postscript
 set output 'outfile.ps'
 set size 0.6,0.6
 set xlabel "Reaction Coordinate"
 set ylabel "dE[kcal/mol]"
 plot 'data.dat' with lines lw 4
 set output
If i open this file in preview, the file is oriented 90° counter-clock wise. This can be fixed with 'ps2eps'.
The command I used was:
ps2eps -f -R + -B -l data.eps
Samstag, 3. September 2011
Python 003: Summing specific items of nested lists
Say we're faced with the challenge of summing the last element of a list of nested lists.
An example might be
where we're interested in the sum of 6+5+6. In Python this can conveniently be done using the reduce/lambda pair of functions:
An example might be
a=[[2,4,6],
   [4,2,5],
   [2,5,6]]
where we're interested in the sum of 6+5+6. In Python this can conveniently be done using the reduce/lambda pair of functions:
>>> reduce(lambda x,y: x+y, [i[-1] for i in a])
17
>>>
Samstag, 30. Juli 2011
Schey 003: Surface Integral over Half Sphere
test
$\left[ \begin {array}{ccc} \sin \left( \phi \right) \cos \left(
\theta \right) &-R\sin \left( \phi \right) \sin \left( \theta \right)
&R\cos \left( \phi \right) \cos \left( \theta \right)
\\ \noalign{\medskip}\sin \left( \phi \right) \sin \left( \theta
\right) &R\sin \left( \phi \right) \cos \left( \theta \right) &R\cos
\left( \phi \right) \sin \left( \theta \right) \\ \noalign{\medskip}
\cos \left( \phi \right) &0&-R\sin \left( \phi \right) \end {array}
\right]$
Dienstag, 12. Juli 2011
Web 002: Interactive Figure
I wrote a script to illustrate the superposition principle. The more cosine functions are superpositioned, the more precise can the position be described (by integrating over the probability density). Naturally, all information about the momentum is lost, since the probability of each momentum component becomes smaller and smaller with increasing superposition number.
The foregoing is illustrated by the below figure.
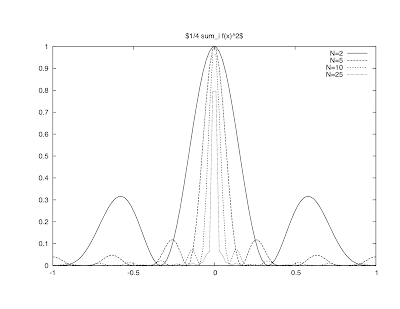
What I want to achieve now is to have this be interactive on the web. Since the only variable in the calculation is an integer (the number of superpositions), I would like to introduce something like a knob, which the user can click and turn and by doing so increase/decrease the number of superpositions. While he is doing this, the figure should update dynamically, i.e. for every selection the correct wavefunction should be displayed.
How can this be done? What are the general requirements for this? We will see.
Montag, 11. Juli 2011
Web 001: Setting up Apache and Running phpinfo() on Mac OS X
Ok, so you just want that phpinfo() running within two minutes on your local Mac because you want to develop your website from your $HOME/Sites directory. Easy. Here's the out-of-the-box solution to that (its done on Mac OS 10.6, PHP and Apache are from the default installation).
- cp /etc/apache/http.conf /etc/apache/back_http.conf # No backup, no mercy.
- sudo vi /etc/apache/http.conf
- You need to change two lines: Locate "DocumentRoot" and set the path behind it to '/Users/yourUserHomeDirectory/Sites'. Then locate the <Directory "/Library/WebServer/Documents"> line and change the path to the one you entered above.
- Remove the '#' sign infront of the line starting with "LoadModule php5_module"
- Save the file and exit.
sudo /sbin/apachectl restart
You can use the two following scripts as a default template. Copy the text and place them two files within the ~/Sites directory.
The index.html file:
<!DOCTYPE html PUBLIC "-//W3C//DTD XHTML 1.0 Transitional//EN"Then enter the following into a file called phpinfo.php and place it in the ~/Sites directory as well.
"http://www.w3.org/TR/xhtml1/D
TD/xhtml1-transitional.dtd">
<html>
<head>
<title>Index Testing PHP</title>
</head>
<body>
<br /><br />
/Users/yourUserHomeDirectory/Sites/index.html
<form method="POST" action="phpinfo.php">
<input type="submit">
</form>
</body>
</html>
<?php phpinfo(); ?>
Set permissions for phpinfo.php to 755 in order to be executable by Apache. Now enter http://localhost/~yourUserHomeDirectory/ into a browser. This will display a minimal page showing the path you entered above and a button. Hit the button and the phpinfo.php script will execute. This should be it.
In case you have trouble getting it running, feel free to leave a comment.
Freitag, 8. Juli 2011
Schey 002: Surface Integral
In Maple:
Schey, Ex. II.5,b.
> 2*Pi*a^2*int(r*(a^2-r^2)^(-1/2),r=0..a) assuming a>0;
                                                  3
                                            2 Pi a

>
Schey, Ex. II.5,b.
Donnerstag, 7. Juli 2011
Shell 007: Zero Padding
Zero padding is useful when naming files and everything should be nicely aligned when listed.
This can be done by using
This can be done by using
for i in 000{1..9) 10
do
    echo $i
done
Freitag, 24. Juni 2011
Jmol 003: Arranging Protein on NW Surface
The below picture was obtained with the following Jmol script.
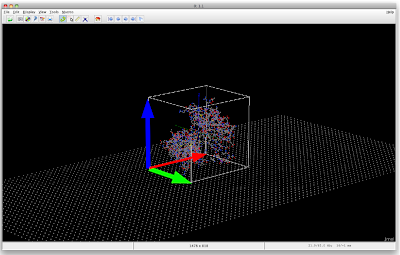
load 1PDB.pdb
load APPEND nwSurface.xyz
model all
axes on
select protein
boundbox {1.1} on
The protein is surrounded by its boundbox. What I now want is to mark the three of the sides of the bound box, as I indicated with arrows added with paint. Maybe the boundbox and the arrows could also be separate "objects" (?), generated on the fly from the structure.
The point is, now the user could click a radio button indicating that the protein is oriented with its (red/green) face towards the wire. If he is not happy with that, he could click the rotate button, returning the box/protein/ensemble ensemble to be oriented with the (red/blue) face towards the wire (for now rotations by 90° is fine). If it is this orientation he expects (depending maybe on binding sites in the protein) he then would click the red/blue radio button and submit the form. Depending on the selected radio button, the appropriate distance of the center of the box to the wire can be obtained.
After a little trying, the following turned out.

The command used for the red vector is
draw xVec vector {-58.19/2.0, -47.57/2.0, -54.71/2.0} {58.19, 0.0, 0.0} width 5.0 color red
What I now require is to have the vectors rotate together with the protein, so maybe the easiest is to have the vectors be part of the protein structure.
Mittwoch, 22. Juni 2011
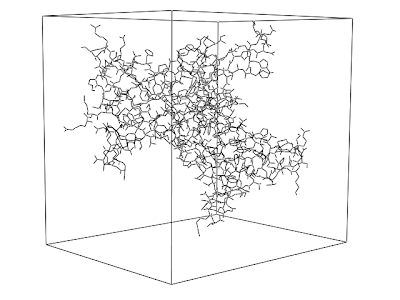
Jmol 002: Control over Two Structures
I loaded two structures into a jmolApplet by the following code:
 A protein structure is placed above an array of carbon atoms which are supposed to illustrate the surface of a nanowire. What I would like to do now is to be able to rotate the protein with respect to the surface (i.e. keeping the surface in the same orientation regarding the indicated coordinate system).
Unfortunately, I dont know how to include Jmol on Blogspot, otherwise I naturally would have included it directly here as well.
The input from Bob Hanson at the Jmol Mailing list is actually pointing me into exactly the correct direction. This script was tested in a local version of Jmol but it should just as well be working in a browser.
Now using <ALT>+<Left_Mouse> the user can rotate the protein structure without changing the surface and <ALT>+<SHIFT>+<Left_Mouse> to drag the structure over the surface.
<!DOCTYPE HTML PUBLIC "-//W3C//DTD HTML 4.01 Transitional//EN"This results in the figure below.
"http://www.w3.org/TR/html4/loose.dtd">
<html>
<head>
<title>UI Controls example</title>
<script src="./jmolDir/Jmol.js" type="text/javascript"></script>
</head>
<body>
<script type="text/javascript">
jmolInitialize("./jmolDir");
jmolApplet(400, "load 1AVD.pdb;\
load APPEND nwSurface.xyz;\
axes on;\
boundbox on;");
</script><br />
</body>
</html>
 A protein structure is placed above an array of carbon atoms which are supposed to illustrate the surface of a nanowire. What I would like to do now is to be able to rotate the protein with respect to the surface (i.e. keeping the surface in the same orientation regarding the indicated coordinate system).
Unfortunately, I dont know how to include Jmol on Blogspot, otherwise I naturally would have included it directly here as well.
The input from Bob Hanson at the Jmol Mailing list is actually pointing me into exactly the correct direction. This script was tested in a local version of Jmol but it should just as well be working in a browser.
load 1PDB.pdb
load APPEND nwSurface.xyz
select protein
set allowRotateSelected True
set dragSelected True
Now using <ALT>+<Left_Mouse> the user can rotate the protein structure without changing the surface and <ALT>+<SHIFT>+<Left_Mouse> to drag the structure over the surface.
Dienstag, 21. Juni 2011
Jmol 001: Loading a Structure File from Disk Through CGI
The function below allow the user to load a structure into a Jmol applet.
#!/usr/bin/pythonNote, all HTML code had to be escaped in order to be posted on the blog.
print "Content-type: text/html\n\n"
import cgi
import cgitb
cgitb.enable()
def getJmolPage(target):
newpage = ''
newpage += '<html>\n'
newpage += ' <head>\n'
newpage += ' <title>Load PDB Form</title>\n'
newpage += ' <script src="./jmolDir/Jmol.js" type="text/javascript"></scri
pt>\n'
newpage += ' </head> \n'
newpage += ' <body> \n'
newpage += ' <script type="text/javascript">\n'
newpage += ' jmolInitialize("./jmolDir");\n'
newpage += ' jmolApplet(400, "load ../x_output/%s.pdb");\n'
newpage += ' </script><br />\n'
newpage += ' </body>\n'
newpage += '</html>\n'
return newpage % (target)
if __name__ == '__main__':
form = cgi.FieldStorage()
target = form['PDBID'].value
print getJmolPage(target)
Donnerstag, 16. Juni 2011
Reading
System/Web Programming
File Permissions: Good short summary of dangers in web programming
HTML/JavaScript: Displaying text when clicking on checkbox.
File Permissions: Good short summary of dangers in web programming
HTML/JavaScript: Displaying text when clicking on checkbox.
JavaScript and Numbers.
Science
Ising Model: Derivative of Magnetization, Source, Phase transition
Lipases: Chemical Industry Review.
Science
Ising Model: Derivative of Magnetization, Source, Phase transition
Lipases: Chemical Industry Review.
Dienstag, 14. Juni 2011
PyMOL 004: Illustrating a periodic system
I have enclosed the structure inside a rectangular box. Now I would like to translate it in order to generate the image of a periodic plane.
Using the supercell.py script on the PyMOL wiki, the following figure was generated. The command was
supercell 40,4,1, withmates=1at the PyMOL prompt.
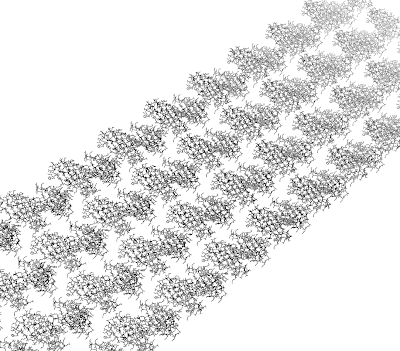
How can I have little boxes around all proteins?
After aligning all proteins on the surface, the output is the following.

Montag, 30. Mai 2011
Shell 006: Replacing String with incrementing index
Lets say we have some text as below.
where we want the "header" be replaced by "model {1,2,3}".
I was pointed out to a couple of solutions over at LinuxQuestions.org
An awk solution.
where 'infile' contains the data.
A bash solution.
An even shorter awk solution.
A one line bash solution
Great to have the support from the online community.
header
foo
foo
foo
header
bar
bar
bar
header
baz
baz
baz
where we want the "header" be replaced by "model {1,2,3}".
I was pointed out to a couple of solutions over at LinuxQuestions.org
An awk solution.
$ awk 'BEGIN { cntr = 0 } /header/ { cntr++ ; print "model", cntr } !/header/ { print $0 }' infile
where 'infile' contains the data.
A bash solution.
#!/bin/bash

filename=data

index=1

for entry in `grep -n model $filename`
do
        line=`echo $entry | awk -F":" '{print$1}'`

        sed -e "$line s/model/model $index/" -i $filename

        index=$(($index + 1))
done
An even shorter awk solution.
awk '$0 = /header/?"model "++c:$0' file
A one line bash solution
unset count; while read line; do [[ $line =~ header ]] && line="model $((++count))"; echo "$line" >> oufile; done < infile
Great to have the support from the online community.
Python 002: Averaging over values
A common task is to display raw data together with a more informative average value. The figure below shows the energy of a harmonic oscillator together with the average value of the energy at the same time. The values are from a Monte Carlo simulation.
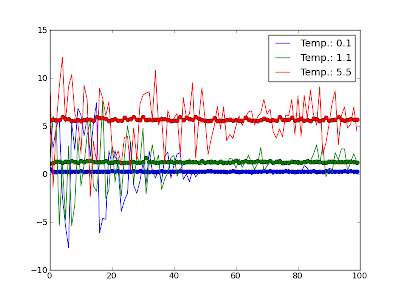
The question is how to generate the list of average values most efficiently. In the present case, I calculated the average over something like nsamples/100 values and plotted a corresponding point. But if I want to let the list of averages be of the same length as the list of raw data points, i naturally will be able to only plot the first points of the raw data. How is this done correctly?
Eav = array([reduce(lambda x,y: x+y, i)/len(i) for i in [E[i:i+segm] for i in range(0, len(E), segm)]] )
I have been pointed out to a solution making use of the numpy.convolve method.
means = convolve(E, ones(100)/100.0, 'same')
This calculates the average throughout the simulation, instead of only at the end. By doing so, the number of calculated averages is the same as the number of samples. The figure below shows the obtained output.
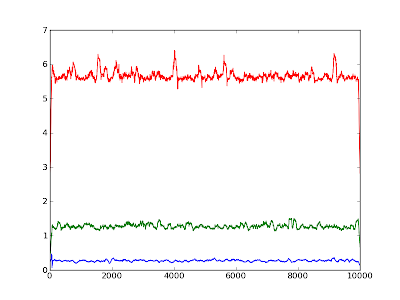
I only plotted the average now, since the raw data overlays the graphs of the average. What I wonder is why the average at the end drops to zero.
Preparing a Presentation
I learned these lessons on how to do a presentation. The key points one has to address while preparing a talk are
- Who will be my audience? This is what should guide in the design and layout of the talk. It decides over what degree of detail to present, ranging from raw data and formulas to graphs of the basic relationships over to cartoon representations of the physical problem.
- How many messages does one slide carry? It should not be more than two. Usually, things are complicated. It is preferred to broadcast fewer information, but have that information understood instead of broadcasting masses and nothing is understood: "If they understand a little, that's better than if they didn't understand a lot." If one slide refers back to a previous one, include it on the slide in a small version to help keeping it in memory. It is also a good idea to keep a couple of extra slides which contain more details, just in case.
These are the lessons I learned up to now on how to present a topic at a talk.
Sonntag, 29. Mai 2011
Griffith, Ex. 2.7
I'm checking out this integral.
The solution (without inserting values) is computed with Maple.
The question would be now, how to get the integral from x=-1 to x=1. I need to tell Maple that z > R. How can I do that?
One a side note, it seems as if I can not view the MathML in Safari. Why is that?
The solution (without inserting values) is computed with Maple.
The question would be now, how to get the integral from x=-1 to x=1. I need to tell Maple that z > R. How can I do that?
One a side note, it seems as if I can not view the MathML in Safari. Why is that?
Montag, 2. Mai 2011
Shell 006: Nested Calls
In Bash a command can be nested by the following syntax:
cd $(dirname $(which prog))
The syntax for command substitution that uses back ticks does not permit nesting. Therefore the $(command) expansion is required.
Mittwoch, 13. April 2011
Shell 005: String processing
A directory contains the following
How can the leading terms be removed?
The syntax is ${i:FROM:BY}. The indexing starts from 0. Also
~/shell $ ls -l
00_01_boxpdb.py
00_01_realign.py
00_02_callPDB2PQR.py
00_03_getPointCharges.py
00_04_getCharge.py
01_01_connect.py
How can the leading terms be removed?
~/shell $ for i in 0*
> do
> mv $i ${i:6}
> done
The syntax is ${i:FROM:BY}. The indexing starts from 0. Also
# Is it possible to index from the right end of the string?

echo ${stringZ:-4}               # abcABC123ABCabc
# Defaults to full string, as in ${parameter:-default}.
# However . . .

echo ${stringZ:(-4)}             # Cabc
echo ${stringZ: -4}              # Cabc
# Now, it works.
# Parentheses or added space "escape" the position parameter.
Shell-004: Selective Listing
Given the case that a number of files are in a directory, file-test.py and at the same time there is a directory called file-test in the same directory. How can only the directories be listed? This is useful when the content of the directories needs to be processed somehow.
Grep matches the beginning of the line output by 'ls' with 'd', which indicates a directory. " 'awk {print $8}' " then prints the 8th column of the output (so the directory name is available again).
ls -l|grep ^d|awk '{print $8}'
Grep matches the beginning of the line output by 'ls' with 'd', which indicates a directory. " 'awk {print $8}' " then prints the 8th column of the output (so the directory name is available again).
Dienstag, 12. April 2011
Vim 005: Efficient formatting
The following example demonstrates how to format a run control file efficiently. The initial PYTHONPATH in the file is
and it is difficult to read. It would be nice to have all directories added to the path on separate lines. In Vim, this can be done by issueing:
\r is the line feed character (apparently it works on Linux, even if its the Windows line feed character). The common Unix linefeed character is \n. \$ escapes the dollar sign so it can be found and replaced/inserted (it would be considered the end of the line if not escaped). Calling the command returns
There remains a colon on all but the last lines. Replacing this would require the command to recognize if it is operating on a line which is not the last one of the selection.
export PYTHONPATH=$HOME/shellscripts:$HOME/tree/lib64/python2.4/site-packages:$HOME/kemibin/2010/woche_03/wave/
and it is difficult to read. It would be nice to have all directories added to the path on separate lines. In Vim, this can be done by issueing:
:s/:\$/:\rexport PYTHONPATH=\$PYTHONPATH:\$/g
\r is the line feed character (apparently it works on Linux, even if its the Windows line feed character). The common Unix linefeed character is \n. \$ escapes the dollar sign so it can be found and replaced/inserted (it would be considered the end of the line if not escaped). Calling the command returns
export PYTHONPATH=$HOME/shellscripts:
export PYTHONPATH=$PYTHONPATH:$HOME/tree/lib64/python2.4/site-packages:
export PYTHONPATH=$PYTHONPATH:$HOME/kemibin/2010/woche_03/wave/
There remains a colon on all but the last lines. Replacing this would require the command to recognize if it is operating on a line which is not the last one of the selection.
Vim 004: Pasting into Vim
If a piece of text is copied into the clipboard and then pasted into Vim (while in insertion mode), most likely the text will be very ill formatted and kind of "drifting" to the right with increasing line number. Especially this is likely to happen when copying from a formatted document but is very unwanted e.g. when code should be pasted into Vim.
In Vim, use
to enable pasting from the clipboard.
In Vim, use
:set paste
to enable pasting from the clipboard.
Vim 003: Deleting all Lines of given Kind
In a file, all lines containing a given identifier 'IDENT' can be deleted by calling (within Vim):
:d/IDENT/g
Sonntag, 10. April 2011
Shell 005: Redirect Part of a File
Suppose a file contains data starting from a given keyword (the content above the keyword is considered not relevant). If only the content from after the keyword is to be redirected to a new file (in a batch), this can be done using sed.
"!" tells it to ignore everything from the start of the file "0" to the first line containing the keyword "/DONE/", then p makes it print the rest, with a shell redirection of the output to a new file.
Regards to David the H. at LinuxQuestions for pointing this out to me.
for i in file-*.log
do
    sed -n '0,/DONE/!p' $i > ${i/file/new}
done
"!" tells it to ignore everything from the start of the file "0" to the first line containing the keyword "/DONE/", then p makes it print the rest, with a shell redirection of the output to a new file.
Regards to David the H. at LinuxQuestions for pointing this out to me.
Freitag, 8. April 2011
Vim 002: Submitting Vim Command from the shell
A Vim command can be submitted to Vim directly from the shell (without entering Vim) by calling:
Notice the '+' operator within the command string. Also notice the 'wq' command to save and "exit" Vim once it finished its job. This is an excellent way of processing a batch of files.
vi "+:%s/+0/+1/g" "+wq" $i
Notice the '+' operator within the command string. Also notice the 'wq' command to save and "exit" Vim once it finished its job. This is an excellent way of processing a batch of files.
Shell 003: Tail
All but the top 40 lines of a file can be catted to a new file by calling:
Notice the backtics to evaluate the cat and wc calls in the first line. Also notice the '-' sign in front of the numeric argument to the tail command.
count=`cat file.dat|wc -l`
tail -n -$((count-40)) file.dat > newfile.dat
Notice the backtics to evaluate the cat and wc calls in the first line. Also notice the '-' sign in front of the numeric argument to the tail command.
Dienstag, 5. April 2011
Montag, 4. April 2011
Shell 004: Arithmetic Extension
Sometimes it is useful to have an arithmetic extension available in the BaSH. In its most primitive form this could look something like
I found it here.
mzh @ ~/shell $ for i in {1,2,3}
> do
> tmp=$((i*i))
> echo $tmp
> done
1
4
9
I found it here.
PyMOL 003: Displaying Atom Coordinates
In PyMOL, the coordinates of atoms of a selection can be printed by first selecting the atoms of interest and then calling
PyMOL>iterate_state 1, sele, print name, x, y, z
where 'sele' is just the selection created when clicking on the atoms of interest.
Sonntag, 3. April 2011
GAMESS 002: Copying to a new job type
When a batch of optimizations finished, the final coordinates need to be transfered to for example a HESSIAN job. At the same time, the file should change the extension from .log to .inp and the jobtype identifier should change from opt to hes. On the command line, this can be done in a for-loop by issueing:
mzh @ ~/shell $ for i in a-{1,2,3}-opt.log
do
OPTLOG=$i
HESLOG=${OPTLOG/opt/hes}           # Rename jobtype
HESINP=${HESLOG/log/inp}           # Rename extension
grep -i -A 29 "equilibrium" $OPTLOG|tail -n 26 >> $HESINP
done
I dont know how to rename two parts of a file name in the same step, i.e. how to get from 'a-{1,2,3}-job-opt.log' to 'a-{1,2,3}-job-hes.inp' in one command. That's why I rename part of the file step by step. Then, after I have the filename ready in a variable, the important content is written to this file. The molecule has 26 atoms, but the identifier is 29 lines above the end of the coordinate block, that's why I tail it (I dont know how to identify an empty line which terminates the coordinate block-- there is no identifier for the ending of the coordinate block). The generic command would be to insert N+3 where N is the number of atoms in the file.IMPORTANT: remember the '>>' append operator when transfering to the input file.
Now a more tricky part, transfering the Hessian matrix from the GAMESS output .dat file to the SADPOINT job file. How can this be automated in a smart way?
This line of code is the solution:
Now a more tricky part, transfering the Hessian matrix from the GAMESS output .dat file to the SADPOINT job file. How can this be automated in a smart way?
This line of code is the solution:
mzh ~/shell $ awk '/ \$HESS/,/^ \$END/' hess.dat >> sad.inp
I dont know what the ',' does. Note the quotes.
There also appear to be other ways of doing this:
mzh ~/shell $ ruby -ne 'print if /\$HESS/../\$END/' file
or
mzh ~/shell $ f=0;
while read l;
    do [[ $l =~ \$HESS ]] && f=1;
        [[ f -eq 1 ]] && echo $l;
        [[ $l =~ \$END ]] && f=0;
    done < file
These other options are less readable to me, but seem to work nicely.
Freitag, 1. April 2011
Donnerstag, 31. März 2011
Python 002: Version Introspection
When working with Python 2.x and Python 3.x at the same time, its quite probably that the version of the currently running version of Python becomes a question of interest.
One can obtain the version of the running Python instance by issueing
One can obtain the version of the running Python instance by issueing
from sys import version_info
if version_info < (3,0):
   print version_info
else:
   print(version_info)
Vim 001: Editing Code
Consistent formatting of code is essential for efficient developement.
A part of the formatting also comes from introducing syntactic elements such as stars to group the code by content. In Vi this can be done in a simple way.
where N is the number of stars to be added, e.g. 40, or 78 to indicate the maximum width the code should take up.
A part of the formatting also comes from introducing syntactic elements such as stars to group the code by content. In Vi this can be done in a simple way.
ESQ -> N -> a -> * -> ESQ -> RETURN
where N is the number of stars to be added, e.g. 40, or 78 to indicate the maximum width the code should take up.
Python 001: Module introspection
Python has great self introspection capabilities.
Adding the above to the module should make it possible to get the location and name of the module in scope at runtime.
Sometimes flow of control runs through different modules. If I want to know which module is currently in the scope, here is how I can do this:
#!/usr/bin/env python3

import os.path
def getModuleName():
    print("Current module:".ljust(30), os.path.abspath(__file__))

getModuleName()
Adding the above to the module should make it possible to get the location and name of the module in scope at runtime.
Mittwoch, 30. März 2011
PyMOL 003: Synchronizing Atoms in PyMOL
- Show both structures as lines
- Show the rank of the atoms.
- Follow the backbone ranks of both files until they loose synchronization.
- Adjust one to the other, from now on always adjust this one to the other. Only one of the files is changed.
PyMOL 002: Description of the Program
When starting the work with PyMOL, it might seem odd that there is no such thing like an 'undo' button. But I believe this only seems odd because the user has expectations towards the program which it never intended to meet in the first place. Its not a program to use as one would use Word or any other Editor. In fact, I believe its intended to be used in the way one uses a black board. One quickly fills it up with notes, and then erases it to start over again with the next part of what one wants to write down, like in a lecture. One does not want to keep the black board in the way one wrote on it. If something is required to be recalled (e.g. because one wants to be able to present something at a meeting without having to search for all kinds of files) one can prepare a PyMOL session file.
Also, PyMOL is not a modeling program (even though its modeling capabilities are already quite impressive). Instead, its a viewer and an analysing tool which is extensible. And this is the most important part about it I believe. It is extremely friendly to the user who wants to extend it by his or her own functionality. All that is required is some knowledge about Python. The PyMOL API is quite introspective, so every function documents itself and this is really makes the extension work convenient.
Also, PyMOL is not a modeling program (even though its modeling capabilities are already quite impressive). Instead, its a viewer and an analysing tool which is extensible. And this is the most important part about it I believe. It is extremely friendly to the user who wants to extend it by his or her own functionality. All that is required is some knowledge about Python. The PyMOL API is quite introspective, so every function documents itself and this is really makes the extension work convenient.
GAMESS 001: Files
A short introduction into the files obtained from running GAMESS calculations.
Which file containes what, where to find coordinates from optimization jobs and how to efficiently transfer them to new input files.
There is a tool called DATAGAM which can fetch various $GROUP content from GAMESS files. It's not exactly clear to me how it works, but by issuing the following command, at least I was able to transfer the equilibrium geometry to a new file.
mzh @ ~/software/DATAGAM $ datagam -G 4-2-a-1-1-rm1--rm1.log
This is optimize run
Equilibrium geometry (with unique and all coordinates) will be saved to file OPTMZ
GAMESS 001: Files
A short introduction into the files obtained from running GAMESS calculations.
Which file containes what, where to find coordinates from optimization jobs and how to efficiently transfer them to new input files.
Which file containes what, where to find coordinates from optimization jobs and how to efficiently transfer them to new input files.
Sonntag, 27. März 2011
Samstag, 26. März 2011
Schey 001: Bereichsintegrale
Ich arbeite gerade an der Theorie zu Bereichs- und Flächenintegralen. Diese ist für die Behandlung der Elektrostatik erforderlich.
Schey macht sich viel Mühe bei der Behandlung von Bereichsintegralen. Wenn ich das soweit richtig verstehe, wird die Fläche S über die integriert wird, auf eine Ebene projeziert. Dann wird über diese Fläche integriert, wobei der Integrand mit dem Wert der Funktion auf der S Fläche multipliziert wird. Das Skalarprodukt aus dem Einheitsnormalvektor auf S mit dem Einheitsvektor in z-Richtung an der Stelle (x,y) liefert die Beziehung zwischen S und der Projektion R. Am Wochenende muss ich dann mal das Kapitel im Zachmann gründlich durchackern. Find das Thema schon ziemlich interessant.
Schey macht sich viel Mühe bei der Behandlung von Bereichsintegralen. Wenn ich das soweit richtig verstehe, wird die Fläche S über die integriert wird, auf eine Ebene projeziert. Dann wird über diese Fläche integriert, wobei der Integrand mit dem Wert der Funktion auf der S Fläche multipliziert wird. Das Skalarprodukt aus dem Einheitsnormalvektor auf S mit dem Einheitsvektor in z-Richtung an der Stelle (x,y) liefert die Beziehung zwischen S und der Projektion R. Am Wochenende muss ich dann mal das Kapitel im Zachmann gründlich durchackern. Find das Thema schon ziemlich interessant.
Sonntag, 20. März 2011
PyMOL 001: Introduction to Indexing
PyMOL is one of the best protein working tools available. There are many useful scripts available and it is extremely powerful, when used correctly. The built-in Python shell makes it essentially a real-time programming environment. The user support is a class of its own. Even more so when compared to e.g. the AutoDock support, which is essentially not existing. This is even more regrettable, since some of AutoDocks features are really unique.
One internal characteristics I would like to know more details about is, what the three labels Rank, ID and Index exactly mean and how they are related to the information contained in a PDB file. Work in progress.
One internal characteristics I would like to know more details about is, what the three labels Rank, ID and Index exactly mean and how they are related to the information contained in a PDB file. Work in progress.
Donnerstag, 17. März 2011
Shell 003: Data Handling
The computation of a transition state (TS) can take a significant amount of time.
For a given system, the TS was first located in a subset of the system and then reinserted into the full system. Then the full system was reoptimized, but unfortunately the TS is no longer confirmed by a frequency calculation.
My guess is that the environment forces the TS into a local minimum. So the idea is not to let the TS readjust to the environment, but only the environment to the TS.
How to include this approach in the file naming?
On another aspect. The following is a situation which I encounter many times. I compute some structure which is part of a reaction. This structure now needs to be processed by different methods. Either as a starting point for a new method which leads to a new geometry, or a method which gives information about the quality of the structure as it is right now (its gradient, its hessian). For the files which arise from this structure, how do I indicate that they are in this "parent-child" relation?
Mittwoch, 16. März 2011
Hydrogens 001
I would like to start a discussion on what methods are available to add hydrogens to protein structures.
This is probably something a lot of people require since its crucial for molecular modeling.
I have encountered several difficulties so far:
This is probably something a lot of people require since its crucial for molecular modeling.
I have encountered several difficulties so far:
- Not all residues of a given type have the same pKa and therefore protonation state. How to tell the program so?
- Ionizable residues can be protonated at different positions (Nd or Ne in histidine).
I will check out the various options available and report on my findings.
The people on the PyMOL Mailing list have provided me with the following options for adding hydrogens:
1) Reduce is a little more clever about adding hydrogens:
http://kinemage.biochem.duke.edu/software/reduce.php
It optimizes the histidine flips. It is a published algorithm, rather than the unsophisticated one that pymol uses, which is not really doing any optimization.
It optimizes the histidine flips. It is a published algorithm, rather than the unsophisticated one that pymol uses, which is not really doing any optimization.
2) NAMD2
3) MolProbity (http://molprobity.biochem.duke.edu/index.php?MolProbSID=6b810d461879ca495f8d7898629dc18c&eventID=15)
The HIS example you mentioned is explicitly treated in Chimera. It shows you all HIS in your protein and you decide which one will be protonated.
5) PROPKA
6) PyMOL
7) OpenBabel
8) AutoDock
9) PDB2PQR. It can complete missing side chain atoms. Gaps in the backbone can not be fixed, apparently. Also, carbonyl groups terminating a gap and peptide nitrogens on the other terminal are not protonated and therefore open shell.
10) WHAT IF
Dienstag, 15. März 2011
Anderson, J. M., Ex. 2.4
We are asked for the Fourier Expansion of
on the interval
What I'm asking myself is, what happens to the expansion coefficients
Another point of interest. The solutions in the book are
Weiterhin bleibt zu vermerken, die Fourierreihe ist eine vollständige Menge orthonormaler Funktionen.
$f(x) = x-x^2$
on the interval
$[-\pi:\pi].$
What I'm asking myself is, what happens to the expansion coefficients
$c_m = \frac{1}{\pi}\left<\cos mx | f\right>$
$d_m = \frac{1}{\pi}\left<\sin mx | f\right>$
, since the function is not symmetric. Is it an even function? Is it an odd function? To me it seems an even function around x=0.5. I guess this shift will have to be included into the integration boundaries.
It seems as if Anderson has a typing mistake in the example for expanding f(x)=x into a Fourier series. Thanks to mYthos for pointing this out to me.
Another point of interest. The solutions in the book are
\[x-x^2= - \sum_{n { } even} \frac{4}{\pi n^3} \sin nx = \\ - \sum_{n even} \frac{4}{n^2} \cos + \sum_{n odd} \frac{4\pi-4}{\pi n^2}\cos n x + \left( \pi - \frac{2*\pi^2}{3}\right)" align="middle" alt="[latex]x-x^2= - \sum_{n { } even} \frac{4}{\pi n^3} \sin nx = - \sum_{n even} \frac{4}{n^2} \cos + \sum_{n odd} \frac{4\pi-4}{\pi n^2}\cos n x + \left( \pi - \frac{2*\pi^2}{3}\right)[/latex]" title="[latex]x-x^2= - \sum_{n { } even} \frac{4}{\pi n^3} \sin nx = - \sum_{n even} \frac{4}{n^2} \cos + \sum_{n odd} \frac{4\pi-4}{\pi n^2}\cos n x + \left( \pi - \frac{2*\pi^2}{3}\right)\]
Now, plotting this for the series expanded to N=100 together with the function returns the following image.

Keine Ahnung, ob das jetzt gut oder schlecht ist. Ein Eintrag auf MatheBoard wurde geschaltet.
Offenbar war da ein Problem. c0 muss noch durch zwei geteilt werden. Ich dachte, dass sei bereits in der Lösung enthalten. Dadurch ergibt sich folgender Term
Offenbar war da ein Problem. c0 muss noch durch zwei geteilt werden. Ich dachte, dass sei bereits in der Lösung enthalten. Dadurch ergibt sich folgender Term
\[F := N \rightarrow -\sum_{n=1}^N \frac{4}{(2n)^2} \cdot \cos (2nx) + \\ { } \sum_{n=1}^N \frac{4\pi - 4}{\pi (2n-1)^2} \cos ((2n-1)x) + \frac{\pi - (2\pi^2/3)}{2}\]

Weiterhin bleibt zu vermerken, die Fourierreihe ist eine vollständige Menge orthonormaler Funktionen.
Shell 002: allsh
Good to know. A shell command can be issued for all running shells at once.
http://72.14.189.113/howto/shell/allsh/
http://72.14.189.113/howto/shell/allsh/
Freitag, 11. März 2011
Donnerstag, 10. März 2011
Books I am working on
I am working on reading through these books:
Best passage from Schey so far:
"Gauss' law is
If you don't understand this equation, don't panic."
Isn't this just wonderful? All people coming from a German education background will know why I am posting this.
- Mathematics for Quantum Chemistry: Jay Martin Anderson
- div, grad, curl and all that: H. M. Schey
Best passage from Schey so far:
"Gauss' law is
\[\iint_S \textbf{E} \cdot \hat{\textbf{n}} \mbox{ dS} = \frac{q}{\epsilon_0}.\]
If you don't understand this equation, don't panic."
Isn't this just wonderful? All people coming from a German education background will know why I am posting this.
Shell 001: How to mv a big number of files efficiently
Suppose a directory contains ten files of the following structure:
The question is, how can the files be changed such that both '1scf' and 'mop' are changed to 'mutant' and 'inp' on one command?
1scf-001.mop
1scf-002.mop
1scf-003.mop
1scf-004.mop
1scf-005.mop
1scf-006.mop
1scf-007.mop
1scf-008.mop
1scf-009.mop
1scf-010.mop
The question is, how can the files be changed such that both '1scf' and 'mop' are changed to 'mutant' and 'inp' on one command?
Various Checks
Who figured out that
The good thing now is that
is available in the blog.
Latex formating together with regular text inside 'pre' elements is still not working.
Check out this tutorial on inline mathematical notation.
http://watchmath.com/vlog/?p=438
Trying MathML from Maple:
Maple Latex Export
$E=mc^2?$
The good thing now is that
$\LaTeX$
is available in the blog.
Einstein most famous equation is \$E=mc^2\$.
Newtons derived the equaiton \\[s=ut+\sfrac{1}{2}at^2\\]
Einstein most famous equation is $E=mc^2$.
Newtons derived the equaiton \[s=ut+\sfrac{1}{2}at^2\]
Latex formating together with regular text inside 'pre' elements is still not working.
Check out this tutorial on inline mathematical notation.
http://watchmath.com/vlog/?p=438
Trying MathML from Maple:
Maple Latex Export
\[\mbox{}+1/2\,{\it cm}\,\cos \left( x \right)
+1/2\,{\frac {{\it cm}\, \left( \sin \left( x \righ t) \right) ^{2}}{\cos \left( x \right) -1}}
+1/2\,{\frac {{\it dm}\,\sin \left( x \right) \cos \ left( \left( N+1 \right) x \right) }{\cos \left( x \right) -1}}-1/2\,{\it dm}\,\sin \left( \le ft( N+1 \right) x \right)
\]
Motivation and Introduction to the Blog
Dear readers
This blog will be keeping track of my experience with quantum chemistry at the University of Copenhagen.
The focus will be on contributing to the discussion on quantum chemical calculations. This can be ranging from comparing values obtained from different methods or about how to handle the data which accumulates. This is something I'm especially interested in.
Also, remotely, I'm intending to post related to programming in Python, Java, LaTeX, Matlab, HTML, JavaScript and for the Bash.
From a quantum chemistry point of view, I most likely will be posting content related to GAMESS and MOPAC.
Finally, I plan to add solutions to various exercises I worked out from text books.
From a quantum chemistry point of view, I most likely will be posting content related to GAMESS and MOPAC.
Finally, I plan to add solutions to various exercises I worked out from text books.
Hopefully this will turn out useful and inspiring.
Thanks for reading and looking forward to your feedback.
Abonnieren
Posts (Atom)