Niewoehner et al. state that "The precise mechanism by which the sFab construct escapes lysosomal sorting and is released on the abluminal side is not known."
This is interesting because it essentially forms part of the frontier of the human understanding of how the cell works.
A paper by Navaroli et al. from 2012 discusses a specific internalization and sorting mechanism, the uptake of the Transferrin receptor (TfR).
As one might guess, internalization of cargo across the cell membrane is a highly complex process. It is highly regulated because the cell wants to avoid internalizing substances which are toxic or which are already present in the cell at sufficient concentrations while at the same time it wants to promote uptake of needed substances.
TfR allows the cell to internalize Transferrin (Tf) which again binds Fe. In the figure below, "receptor" would be TfR (AP-2 is the so called adapter protein type 2 and PM is the plasma membrane). Clathrin is a factor involved in vesicle formation. Conceptually, AP-2 can be understood to have a certain "directing" effect on the vesicle in a similar way as it is attempted to be established for Rabenosyn-5 in this article.
(In the following, the figure caption labels correspond to the figure captions in the article.)
 |
| http://en.wikipedia.org/wiki/Receptor-mediated_endocytosis#mediaviewer/File:Itrafig2.jpg |
Rabenosyn-5 is another endosomal component implicated in early endosome fusion and, as reported in this paper, is found in the vicinity of clathrin coated cell surface regions (Fig. 2 in article).
 | |
| Fig. 2: http://www.pnas.org/content/109/8/E471/F2.expansion.html Top panels: Clathrin Lower panels: Rabenosyn-5 |
TIRF allows to observe fluorescent objects in the cell but can not provide information about the location relative to the cell surface because, as reported, the brightness of an object can result from either its distance to the cell surface or its size. ESL corrects for this and the overlay, TESM, shows the z-axis dependent distribution of clathrin and Rabenosyn-5 at the cell surface: most pixels are blue which means that the majority of the proteins reside at the surface and the surface is populated by both clathrin and Rabenosyn-5.
Since the question is to figure out what Rabenosyn-5 does, the next question to ask is what happens when Rabenosyn-5 is not present in the cell (Fig. 4D in article)?
 |
| Fig. 4D: http://www.pnas.org/content/109/8/E471/F4.expansion.html Sc: Rabenosyn-5 present Si: Rabenosyn-5 not present |
Using siRNA (small interfering RNA), transcription of Rabenosyn-5 can be prevented. The white pixels are TfR. "Sc" is a control for the siRNA function (scrambled siRNA).
Considering the TIRF images (where Sc means that Rabenosyn-5 is active because the surpressing siRNA is scrambled), it is seen that the cell has a higher TfR surface concentration compared to the case where the siRNA is active (right TIRF image). The difference is reported to be a decrease of 75% in the TIRF image. The decrease measured by EPI is less pronounced. Put differently, when Rabenosyn-5 is not produced, the TfR surface amount is reduced which also means that Tf uptake is reduced in TfR depleted cells.
This observation leads to the question, how Rabenosyn-5 controls the cell surface TfR level. Does Rabenosyn-5 regulate TfR gene transcription, TfR gene translation or some other kind of post-translational mechanism? This question is answered by panel A of Fig. 6A in the article.
 |
| Fig. 6A: http://www.pnas.org/content/109/8/E471/F6.large.jpg |
GADPH is used to provide a scale for the measurement.
Possibility of translational regulation. It is known that translation of TfR can be regulated by mRNA parts before and behind the sequence coding for the protein (so called untranslated regions, UTRs).
To test for translational effects of Rabenosyn-5, the host was transfected by TfR-GFP (green fluorescent protein) lacking these UTRs (that means translation of this TfR-GFP can not be regulated). As can be seen, when Rabenosyn-5 is active (Rbsn Sc column), both TfR and TfR-GFP are produced (right most panel, Sc column). However, when Rabenosyn-5 is surpressed (right most panel, Si column) both TfR-GFP (lacking the regulatory sequences) as well as native TfR are present at lower levels.
This means Rabenosyn-5 can not be having an effect on the translation of TfR, because then TfR-GFP levels would not have been reduced (since its translation can not have been regulated)- but the TfR-GFP levels are reduced. Put differently, regulation of TfR by Rabenosyn-5 must be post-translational. So how come the TfR-GFP levels be reduced when this can not be caused by translational regulation?
Possibility of transcriptional regulation. Although there is no experiement discussing this specifically, the question, if TfR levels are regulated at the transcriptional level, is answered by considering that the gene for TfR-GFP does not contain promoter sequences. Therefore it is not possible that Rabenosyn-5 has a transcriptional effect.
Now, if not at the transcriptional nor translational level, how else can Rabenosyn-5 control TfR levels?
The hypothesis is that Rabenosyn-5 acts as a sort of label for how the cell should handle internalized TfR. Once TfR is internalized, it can be directed to the lyosome, i.e. degraded or it can be recycled, that means the TfR is returned to the cell surface and reused. The explanation for the lower levels of TfR in the absence of Rabenosyn-5 is that when Rabenosyn-5 is not present, a larger proportion of TfR gets directed towards the lysosome and subsequently degraded. Evidence for this mechanism is found in that recycling rates are significantly lower in Rabenosyn-5 deactivated cells (Fig. 5D in article).
Put differently, a lower proportion gets recycled to the cell surface resulting in apparent lower TfR cell surface amount. These mechanistic alternatives are illustrated by the red arrows in the figure below (Fig. 6C in article):
This is verified by comparing TfR levels between cells with activated and deactivated lysosomes (Fig. 6B in article).
Under the influence of Bafilomycin A1 ("Baf") an inhibitor of lysosome operation, the TfR level is higher than when the lysosome is operational: the TfR level in the column Baf+/Sc is most intensive because it reports the TfR levels on the cell surface as well as those in the disfunctional lysosomes.
Now, if not at the transcriptional nor translational level, how else can Rabenosyn-5 control TfR levels?
The hypothesis is that Rabenosyn-5 acts as a sort of label for how the cell should handle internalized TfR. Once TfR is internalized, it can be directed to the lyosome, i.e. degraded or it can be recycled, that means the TfR is returned to the cell surface and reused. The explanation for the lower levels of TfR in the absence of Rabenosyn-5 is that when Rabenosyn-5 is not present, a larger proportion of TfR gets directed towards the lysosome and subsequently degraded. Evidence for this mechanism is found in that recycling rates are significantly lower in Rabenosyn-5 deactivated cells (Fig. 5D in article).
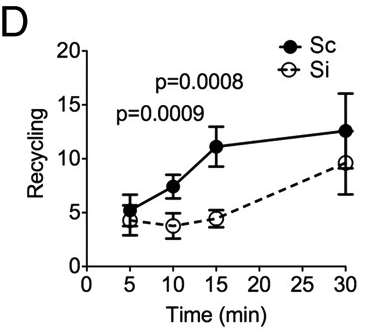 |
| Release rates (arbitrary units) of previously internalized Tf depending on time. http://www.pnas.org/content/109/8/E471/F5.expansion.html |
 | |||
| Fig. 6C: Alternative mechanisms of TfR sorting in presence and absence of Rabenosyn-5. Top panel: Rabenosyn-5 labels clathrin coated TfR vesicles for recycling (and reuse of TfR) to cell surface. Lower panel: Absence of Rabenosyn-5 results in TfR vesicles being directed to lysosome for degrading. http://www.pnas.org/content/109/8/E471/F6.large.jpg |
 | |
| Fig. 6B: Baf: Bafilomycin A1. Sc/Si refer to scrambled and siRNA of Rabenosyn-5. "+": Baf present, "-": Baf absent http://www.pnas.org/content/109/8/E471/F6.large.jpg |
An additional finding is that the absence of Rabenosyn-5 has an effect on clathrin dynamics. In the absence of Rabenosyn-5, the number of clathrin regions and the size of the clathrin regions are increased. In the absence of Rabenosyn-5, increased clathrin signals are reported in the region of the cell nucleus (Fig. 7C in article).
 |
| Fig. 7C: left panels: Rabenosyn-5 present right panels: Rabenosyn-5 deactivated http://www.pnas.org/content/109/8/E471/F7.expansion.html |
Summary. The paper presents evidence for the hypothesis that Rabenosyn-5 prevents TfR from getting directed to the lysosome for degradation. The mechanism of this labeling is however yet to be characterized in detail.
Editorial. I have contacted the senior author of the paper (Prof. Corvera) to ask if she agrees to calling Rabenosyn-5 a labeling agent as stated above. Prof. Corvera added that in Rabenosyn-5 deficient mice severe perinatal phenotypes are observed. Furthermore, she added that based on this work she was approached by geneticists who have found Rabensyn-5 mutations in humans with severe neurological and developmental delays.
Editorial. I have contacted the senior author of the paper (Prof. Corvera) to ask if she agrees to calling Rabenosyn-5 a labeling agent as stated above. Prof. Corvera added that in Rabenosyn-5 deficient mice severe perinatal phenotypes are observed. Furthermore, she added that based on this work she was approached by geneticists who have found Rabensyn-5 mutations in humans with severe neurological and developmental delays.


