Montag, 30. Mai 2011

Shell 006: Replacing String with incrementing index

Lets say we have some text as below.

header
foo
foo
foo
header
bar
bar
bar
header
baz
baz
baz

where we want the "header" be replaced by "model {1,2,3}".
I was pointed out to a couple of solutions over at LinuxQuestions.org

An awk solution.

$ awk 'BEGIN { cntr = 0 } /header/ { cntr++ ; print "model", cntr } !/header/ { print $0 }' infile

where 'infile' contains the data.

A bash solution.

#!/bin/bash

filename=data

index=1

for entry in `grep -n model $filename`
do
line=`echo $entry | awk -F":" '{print$1}'`

sed -e "$line s/model/model $index/" -i $filename

index=$(($index + 1))
done


An even shorter awk solution.

awk '$0 = /header/?"model "++c:$0' file


A one line bash solution

unset count; while read line; do [[ $line =~ header ]] && line="model $((++count))"; echo "$line" >> oufile; done < infile


Great to have the support from the online community.
Python 002: Averaging over values

A common task is to display raw data together with a more informative average value. The figure below shows the energy of a harmonic oscillator together with the average value of the energy at the same time. The values are from a Monte Carlo simulation.
The question is how to generate the list of average values most efficiently. In the present case, I calculated the average over something like nsamples/100 values and plotted a corresponding point. But if I want to let the list of averages be of the same length as the list of raw data points, i naturally will be able to only plot the first points of the raw data. How is this done correctly?


Eav = array([reduce(lambda x,y: x+y, i)/len(i) for i in [E[i:i+segm] for i in range(0, len(E), segm)]] )


I have been pointed out to a solution making use of the numpy.convolve method.
means = convolve(E, ones(100)/100.0, 'same')


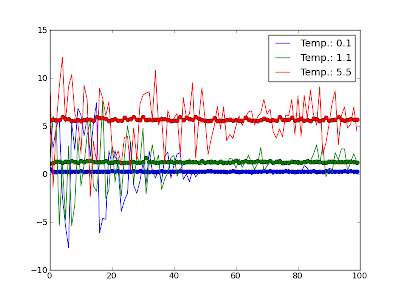
This calculates the average throughout the simulation, instead of only at the end. By doing so, the number of calculated averages is the same as the number of samples. The figure below shows the obtained output.

I only plotted the average now, since the raw data overlays the graphs of the average. What I wonder is why the average at the end drops to zero.

Preparing a Presentation

I learned these lessons on how to do a presentation. The key points one has to address while preparing a talk are
  • Who will be my audience? This is what should guide in the design and layout of the talk. It decides over what degree of detail to present, ranging from raw data and formulas to graphs of the basic relationships over to cartoon representations of the physical problem.
  • How many messages does one slide carry? It should not be more than two. Usually, things are complicated. It is preferred to broadcast fewer information, but have that information understood instead of broadcasting masses and nothing is understood: "If they understand a little, that's better than if they didn't understand a lot." If one slide refers back to a previous one, include it on the slide in a small version to help keeping it in memory. It is also a good idea to keep a couple of extra slides which contain more details, just in case.
These are the lessons I learned up to now on how to present a topic at a talk.

Sonntag, 29. Mai 2011

Griffith, Ex. 2.7

I'm checking out this integral.
intzRuz2+R22zRu32,u;


The solution (without inserting values) is computed with Maple.
Rzuz2z2+R22zRu
The question would be now, how to get the integral from x=-1 to x=1. I need to tell Maple that z > R. How can I do that?
One a side note, it seems as if I can not view the MathML in Safari. Why is that?

Montag, 2. Mai 2011

Shell 006: Nested Calls

In Bash a command can be nested by the following syntax:

cd $(dirname $(which prog))

The syntax for command substitution that uses back ticks does not permit nesting. Therefore the $(command) expansion is required.